Making maps in 2016
2016-12-16
I’ve been working at Mapbox for almost a year now and it feels like a good time to write a 50,000 foot view of how maps for the web are generally made. I’m greatly inspired by the many educational posts geared towards constructing web maps, and really like the anatomy style posts. One thing I’ve always missed, though, is how a map system is built. How does one go from source data to tiles to storage to mapping library to request to rendering on a screen? Here’s my attept to illustrate this system.
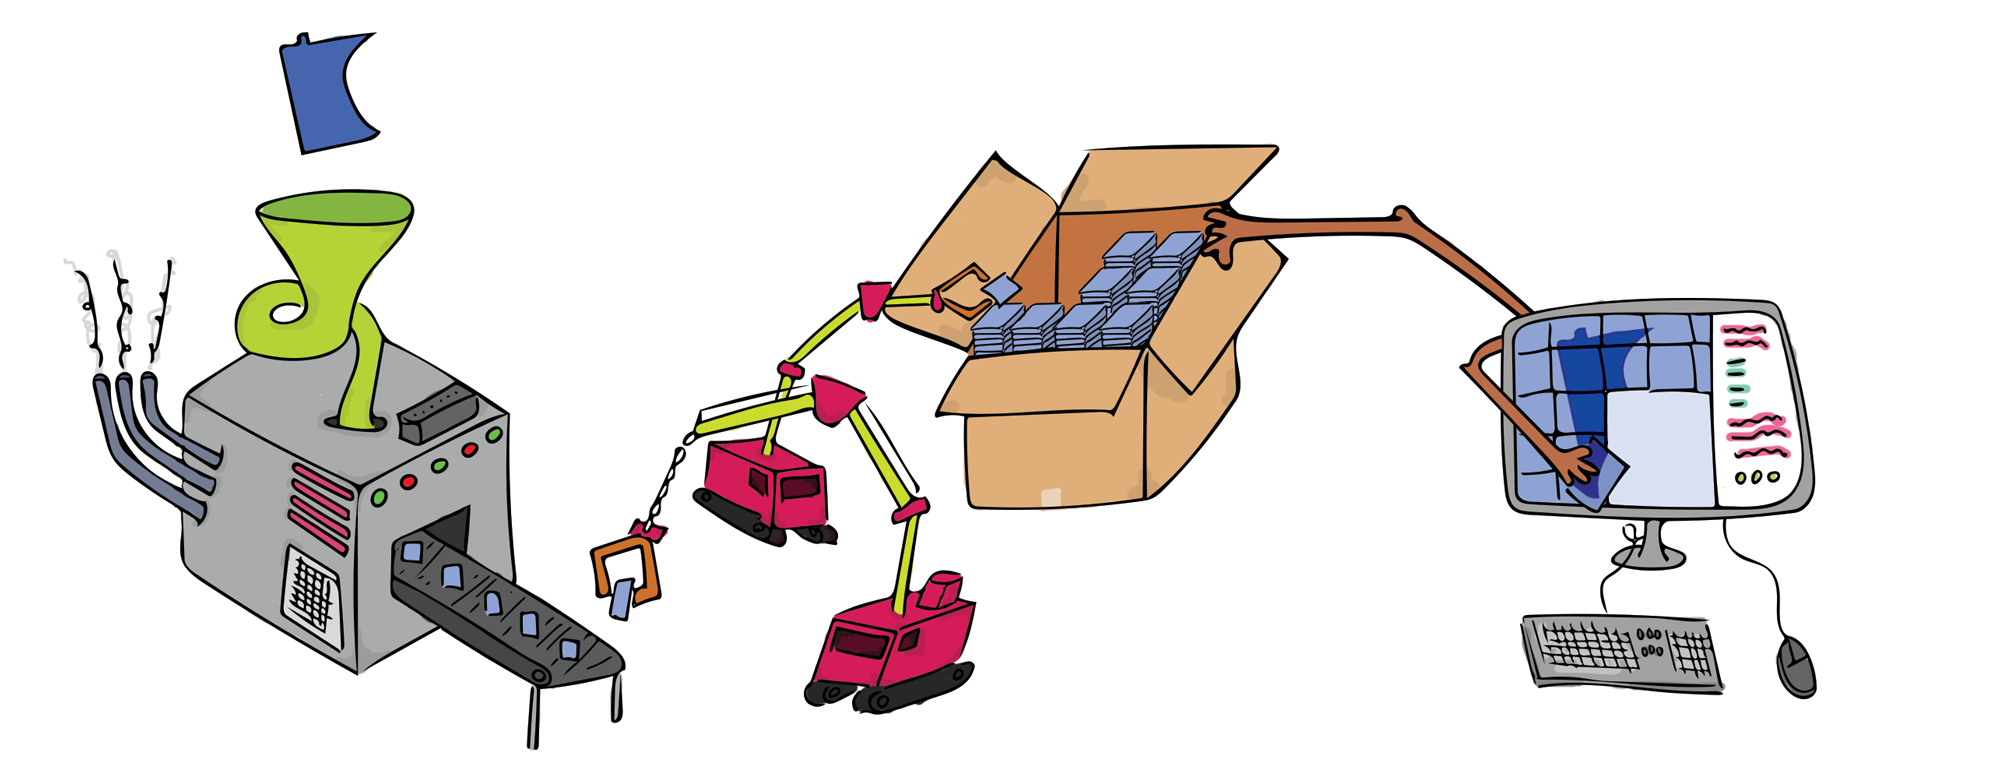
Above is a series of components representing a full scale mapping system. The rest of this post will go through each of these components and talk about real-world examples of each.
Data (Minnesota)
The first part of making a map is data. Datasources can be big or small in filesize or extent. The most obvious large-scale data source is Open Street Map (OSM). Mapbox builds its core styles with OSM, which is world-wide and ever changing.
Data processing (funnel)
In order to make your data ready for mapping, it’s good to prepare it for the tools ahead in the pipeline. In the case of OSM data, the entire planet consists of “nodes”. These nodes, although quite useful for OSM’s cases, aren’t particularly helpful for standard GIS systems that expect geometry like Points, Lines, and Polygons. For large scale data sources, using a database infrastructure like PostGIS is extremely helpful for sanitizing and cleaning data. In the case of OSM, processing can look like this:
- Ingest OSM node data
- Select only the data you want, i.e. road network information
- match nodes and IDs to create OGC valid geometries
- output into a new source, which could also be a PostGIS database
Tiling machine (machine) & tiles (blue squares)
The first parts of the mapping system fit into many workflows outside of building web maps. The same can be said about many of the components if you look at them individually. The tiling machine, though, is one made for mapping. Map tiles are squares of the earth that cover the entire extent of a datasource. Each map tile exists at an XY grid coordinate of the planet, as well as a Z coordinate (referred to as “zoom”). I recommend reading Mapbox’s “how do web maps work” guide to learn more about map tiles. A tiling maching is something that outputs map tiles by passing in source data and the ZXY information.
Say we have the state of Minnesota and want to make a tile like this one, which is of the north eastern point of the state. A tiling machine needs four pieces of information:
- The source data (our Minnesota data source)
- The
Xtile coordinate - The
Ytile coordinate - The
Zzoom level at which to tile
Pass this information in, and you get a tile out. For the sake of continuity, this post will not go into the difference between image and vector tiles - we are assuming every tile is a vector tile. Check out this page to learn more about vector tiles, which have the .mvt file extension.
A well known tiling machine is Mapnik, which is written in C++ but has a widely used Node.js port.
Conductor (cranes)
Once a tiling machine spits out a tile, the map system needs to know where to put it. Thus the ZXY information must be preserved through this process. I’m going to refer to this component as the “conductor”, which I want to highlight is neither formal or colloquial, just what made sense to me while writing.
The conductor typically wraps itself around the tiling machine and the placement of tiles into storage (discussed below). An example of this type of conductor mechanism is the tilelive project, which is an open source project by Mapbox that allows you to stream tiles from source to sink (storage). Systems like tilelive can include tiling machines themselves, such as Node Mapnik.
Storage (box)
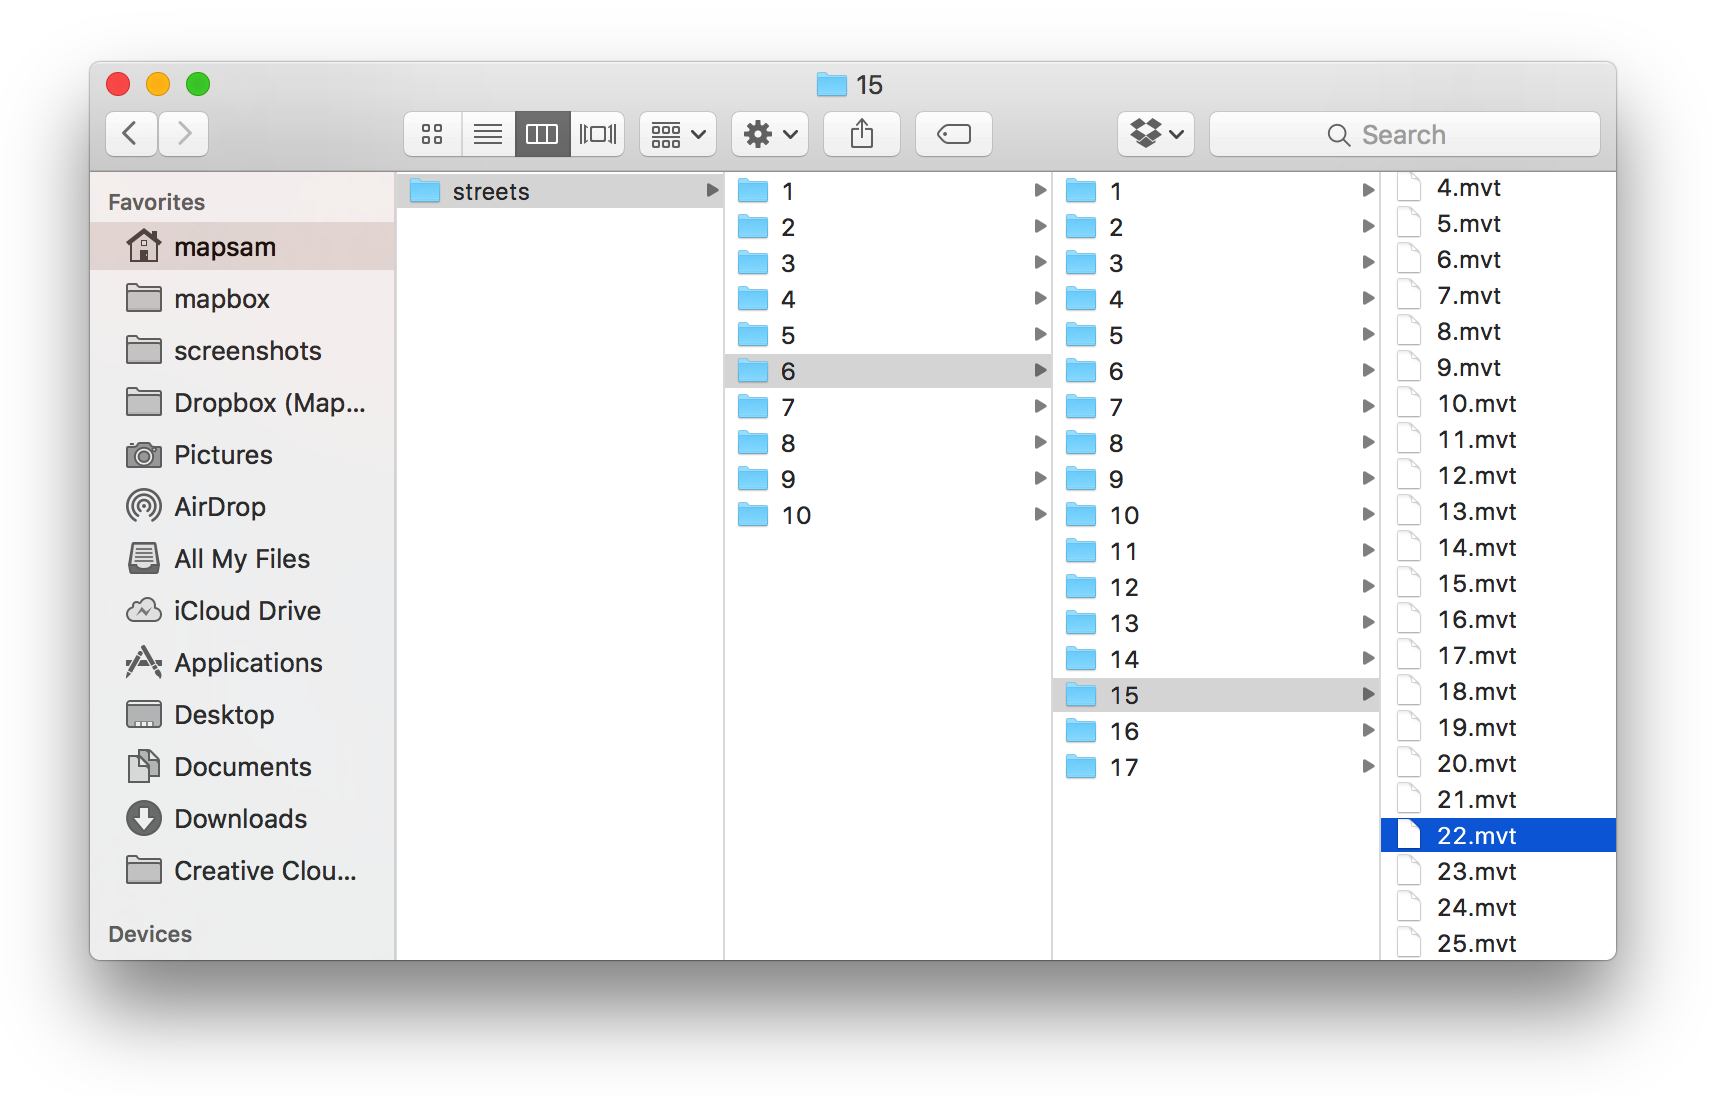
The most common way to store a tile is in a filesystem format where the directories refer to the ZXY values individually. If I was storing maps on my laptop, here’s what that filesystem structure would look like:
/Users/mapsam/maps/streets/{z}/{x}/{y}.mvt
The Minnesota tile above would be:
/Users/mapsam/maps/streets/6/15/22.mvt
Pretty neat! I can have an entire tileset living on my computer. But that doesn’t allow me to share my map tiles with anyone else. Where can we put these somewhere accessible to anyone? A very common static file storage system is AWS’s S3 service. The same URI above would look like this:
s3://mapsam/maps/streets/6/15/22.mvt
AWS allows you to register domains to endpoints in S3, so you could eventually have a URI that looks like this for retrieving tiles:
https://api.mapsam.com/maps/streets/6/15/22.mvt
Once tiles are stored and available to others, it’s up to a mapping library to find those tiles and do something with them, such as rendering them on a screen.
Mapping library (computer arms) & screen to render (computer)
Generating tiles is just half the battle. Rending vector tiles in a browser requires a mapping library that can pack a punch. One of such libraries is Mapbox GL JS. At its core, Mapbox GL JS is a WebGL rendering library but it also knows how to handle geographic information. This library performs the following operations:
- compute the geographic extent represented by the computer’s screen dimensions, which also requires the library to set an arbitrary
Zvalue. These values are used to generate a list of tiles that need to be requested. - request tiles from a remote service, such as AWS S3 (discussed above)
- decode vector tiles from their binary format into a readable javascript object
- match style properties to newly decoded features
- generate WebGL buffers to apply styles and draw on the screen
- update itself based on user interactions (updates such as requesting more tiles, rotating and redrawing, updating the styling of geographic information)
The hands of this illustration represent the mapping library grabbing tiles from the storage box. The computer is able to calculate these GL buffers effeciently thanks to modern graphics cards.
Overall, a mapping system is built of a lot of moving parts, all of which must elegantly interact with each other but also be modular enough so you can update, edit, and use them elsewhere. It can be fun (but expensive) to set all of this stuff up yourself - but you’ll truly understand how web maps work from source data to rendering tiles on a screen.