First month at Mapbox
2016-02-25
Earlier this year I began working at Mapbox! My first month on the job has revolved around ensuring geographic data is reliably created, stored, and shared. A ton of Mapbox’s tools and products rely on Mapnik, which refers to itself as an open source toolkit for developing mapping applications. Mapnik does a lot, but lately we’ve been pushing really hard on ensuring all of the vector tiles it produces are compliant with the Mapbox Vector Tile Specification.
What are vector tiles?
Vector tiles are a way to store geographic data like points, lines, and polygons. Vector tiles need to be rendered by a client or service, like Mapbox GL JS.
Originally, map tiles were stored as images like the one below. These images were rendered from geographic data and a set of styles. In the end, the image has no concept of what data are encoded, unlike vector tiles.
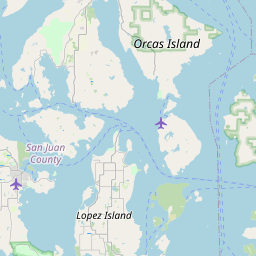 An image tile,
 http://b.tile.openstreetmap.org/10/162/353.png
Styling vector tiles
Unlike image tiles, vector tiles aren’t styled by default. This allows vector data to be styled quickly and dynamically, allowing for styles to be updated on the fly instead of re-rendering an image tile. To create a vector tile style, you can use Mapbox Studio or roll your own by following the Mapbox GL Style Reference.
 Here’s the same spot in the world as the image above, but as a vector tile without any styles.
Rendering a map with Mapbox GL JS requires two things:
- Tilesource - the vector tile source you want to render. This can either be custom data uploaded via Mapbox Studio or dynamically added in Mapbox GL JS using the
.setDatamethod. - Style - a style that references properties and geometries in the tilesource and styles them accordingly. This specifies things such as “road line stroke width is 1px” or “all polygons with type ‘park` have green fill”.
A map created by Mapbox GL JS rendering vector tile sources with a particular style, created in Mapbox Studio.
<div id="map"></div>
mapboxgl.accessToken = 'access_token';
var map = new mapboxgl.Map({
    container: 'map',
    style: 'mapbox://styles/mapsam/cikg2spcb001d9sm69lo7bhpz',
    center: [-120.897351, 47.613391],
    zoom: 6
});
Notice how the code above doesn’t have a source? That’s because the style itself has a reference to a source built in. If you download the style (JSON format) you can find the following embeded in it:
{
  "sources": {
    "mapbox": {
      "url": "mapbox://mapbox.mapbox-streets-v7",
      "type": "vector"
    }
  }
}
How is geometry encoded into a vector tile?
The most common way to encode a vector tile is via the Mapbox Vector Tile Specification. This specification tells developers and tile creators how to store geographic data, meta data, and generally how to make vector tiles as relyable as possible for tools that render them.
Vector tiles store representations of geographic data like points, lines, and polygons, but not in a latitude or longitude format. Each vector tile (a square) is a grid with geometries encoded as points along that grid (i.e. 0,0 or 2,5). Coordinates are encoded as integers from the top left of the grid using the following commands:
MoveTo(X,Y)- Pick up your marker and move X,Y coordinates and then put down your marker and make a pointLineTo(X,Y)- Draw a line with your marker from your current position to a coordinate X, and Y away.ClosePath()- Draw a line from your current position to the last MoveTo Position.
My first big project at Mapbox was writing up a lot of this information in the Mapbox Vector Tile Specification page on mapbox.com. Check it out at www.mapbox.com/vector-tiles/specification/.